1 March 2023
'Your home, your voice' survey results
'Your home, your voice' survey results
The results from our 'Your home, your voice' survey are in, thank you to those who took part to make your voice heard.
Why did we carry out the survey?
‘Knowing our customers’ was one of our Business Plan objectives for the year 2022-23. Really knowing who our customers are will help us to plan our services for the future and provide a more tailored customer experience each time you interact with us.
We designed the survey to give our customers the opportunity to feedback about how they think we’re performing.
To prepare for the survey, we consulted with our engaged customers and our staff to find out what questions we should ask, to get the best results out of the survey.
How did we contact customers?
It was important to us that we gave all customers the opportunity to take part in the survey.
Lead and joint tenants were contacted via 4 main contact methods;
- Text
- Phone call
- Post
To make sure we raised awareness about the survey, and supported everyone to take part, we also;
- Carried out door-knocking
- Engaged with community groups to raise awareness
- Produced an easy read version
- Worked with Housing Plus staff in supported accommodation to encourage their customers to take part
The survey opened to customers on the 2nd November and closed on 16th December 2022.
In total, we received 5020 individual responses to the survey.
What were the survey results?
Thanks to the high response rate, we now know more about our customers and what is important to them.
Some examples of the interesting demographic insights we have found show that;
- We have 62 different languages spoken by our customers who responded to the survey
- The average household size is 2.3 people
- 21% of respondents are unpaid carers
- 5% have served in the armed forces
- 13% have experienced homelessness
We asked the question – ‘What is your country of birth’ in the survey and 82% of respondents said they come from the UK. The 18% of customers who were born outside of the UK, represent a wide geographical range of nationalities.
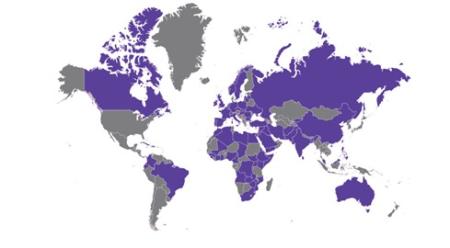
Countries coloured in purple are where our surveys respondents are from.We wanted to make sure that customers had an opportunity to pass on their feedback in an open-ended question. To do this, we included the following question to the survey;
“Is there any support that YHN could offer you to help you in your tenancy”
3247 customers answered this question, some customers responded with more than one suggestion for support in their answer.
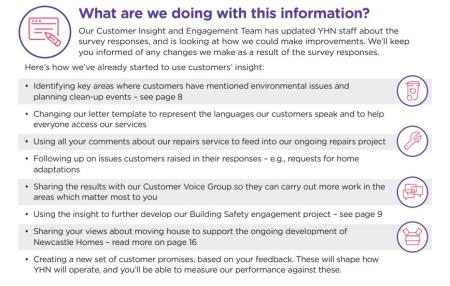
YHN’s Customer Insight and Engagement Team have analysed the results of this question and grouped together similar answers. From this we have been able to identify the top 10 responses to the question, which are (ranked in order of number of responses);
- Nothing (42%) – customers answered ‘no’, ‘nothing’ or mentioned something that was positive but did not ask for further support.
- Repairs (13%) – customers mentioned that something needs fixed or they have an issue in their house such as leaks, roof repairs, general repairs needed internally to property
- Communicating with YHN (6%) – Customers mentioned they would like to improve communicating with YHN to report an issue or getting information from YHN about an issue.
- General support (6%) – Customers mentioned that they do want support but haven’t told us what support this would be.
- Help with moving house (6%) – Customers saying they would like to move to a new property for reasons such as health, age, growing family, wanting to downsize etc.
- General improvements to services (5%) – Customers gave feedback about how they would improve our service and how we should operate.
- Environmental improvements (4%) – Customers mentioning outdoor maintenance (e.g., garden maintenance, landscaping, trees, leaf clearance), waste management (e.g., litter, bins), pest control, accessibility (e.g., need paving levelled, outdoor lights added), roads/paths (e.g., request for some issues which are not YHN related like drop curb requests, off-street parking).
- Safety (4%) – Customers mentioning reports of anti-social behaviour or additional security measures or safety adaptations to feel safer at home.
- Changes to policy and procedures (3%) – Customers mentioning that they would like YHN to review some of the ways we operate, some of which are not YHN policies, for example changing the rent cap/bedroom tax. Also including customers mentioning they would like YHN to follow up on actions outstanding.
- Property upgrades (3%) - Customer requesting an upgrade to their home in some way, e.g., boiler, windows/doors, fire door, roof, kitchen, bathroom.
Why did we ask the Tenant Satisfaction Measure questions?
In the survey, we asked the new Tenant Satisfaction Measure questions, which have been designed by the Regulator of Social Housing to measure how all social landlords are performing. This was a great opportunity to ask our customers how they think we’re performing against these measures. We will be asking customers these questions again, and next time we will be reporting the findings to the Regulator. More information about the Tenant Satisfaction Measures can be found here - https://www.gov.uk/government/news/regulator-of-social-housing-to-introduce-tenant-satisfaction-measures-from-1-april-2023
These were the results from this survey:
|
Tenant Satisfaction Measure |
% Satisfied |
% Dissatisfied |
|
TP01: Overall satisfaction with YHN |
64.9% |
18.5% |
|
TP02: Satisfaction with overall repairs service |
64.3% |
25% |
|
TP03: Satisfaction with time taken to complete most recent repair |
59.1% |
30.5% |
|
TP04: Satisfaction that the home is well-maintained |
63.1% |
21.8% |
|
TP05: Satisfaction that the home is safe |
68.1% |
18.6% |
|
TP06: Satisfaction that YHN listens to customer views and acts upon them |
49.0% |
23.1% |
|
TP07: Satisfaction that YHN keeps customers informed about things that matter to them |
59.1% |
15.2% |
|
TP08: Agreement that YHN treats customers fairly and with respect |
66.1% |
10.9% |
|
TP09: Satisfaction with YHN’s approach to handling of complaints |
30.0% |
51.7% |
|
TP10: Satisfaction that YHN keeps communal areas clean and well-maintained |
61.4% |
23.9% |
|
TP11: Satisfaction that YHN makes a positive contribution to neighbourhoods |
53.6% |
17.1% |
|
TP12: Satisfaction with YHN’s approach to handling anti-social behaviour |
47.5% |
17.5% |
How representative was the survey?
YHN customers’ homes cover a wide geographical spread of Newcastle, spread out across 2037 different postcodes in the city. 76% (1556) of customer’s postcodes were represented by survey respondents, showing that we had a broad response across the whole city.
4.5% of YHN customers live in sheltered accommodation and Assisted Living properties. We received 202 responses from these customers, making up 4% of the overall response rate.
We have also checked that we had a representative cross section of survey responses for our different hub areas (Kenton, Outer West, Walker, West End and East End), different age categories, types of homes (e.g., flat, house, bungalow etc), household size and ethnicity.
Thank you to everyone who took the time to take part in the survey.
For more information about how to get involved with YHN and help us to continue shaping our services based on your feedback, email getinvovled@yhn.org.uk.
To view the results watch our video below.
'Your home, your voice' results